
Soybean Outlook: Record Plantings Could Be a Selling Point
[box type="alert" border="full" icon="none"]March SpecialReceive a free 2018 Commodity Trading Guide with a new multi-month Daily Comments subscription. More Info | Trial | Subscribe[/box]
[box type="info" border="full" icon="none"]This was originally published on March 15th to our subscribers...with trade suggestions. To get these reports as they are released Subscribe today or take a Free Trial![/box]
Download the Full Report (PDF)
 Once the focus of attention shifts away from crop losses in Argentina to the new crop situation in the US, the soybean market should be vulnerable to either a bear trend or at least a significant downside correction into the spring planting season. The USDA Planted Acreage and Grain Stocks reports on March 29th will set the tone for the new crop season. These reports typically spark heavy volatility in the markets and can sometimes set a trend into the planting season in April.
The soybean market appears to have posted a significant top on March 2nd, with crop losses in Argentina becoming better known and traders suspecting that the Brazilian crop would be high enough to offset some of those losses. The weather volatility season in South America is close to an end, and traders are switching their focus to trade issues between the US and China and whether China will move to restrict purchases of US soybeans. While China will need US soybeans over the long run, they may threaten to reduce US purchases as South America’s new crop becomes available, and this would be seen as a bearish force over the near term.
2018/19 Supply Demand Setup
The USDA Outlook Forum in February pegged their initial forecast for 2018/19 US soybean planted area at 90.0 million acres. But with November Soybeans rallying 80 ½ cents (+8.3%) off of the January lows, we are looking for plantings to come in closer to 92.2 million. Yield hit a record high of 52 bushels per acre in 2016 on nearly perfect weather, whereas yield last year was down to 49.1 bushels per acre on below average conditions. With normal weather, we could expect a yield near 49.8 bushels per acre for this coming season, which would bring production in around 4.553 billion bushels. As a result of the damage to Argentina’s crop, we should see an increase in the amount of US exports over the next several months, which could pull ending stocks 2017/18 down to 525 million bushels from the current 555 being projected by the USDA. But even with this drop, total supply for 2018/19 could reach a record-high 5.103 billion bushels.
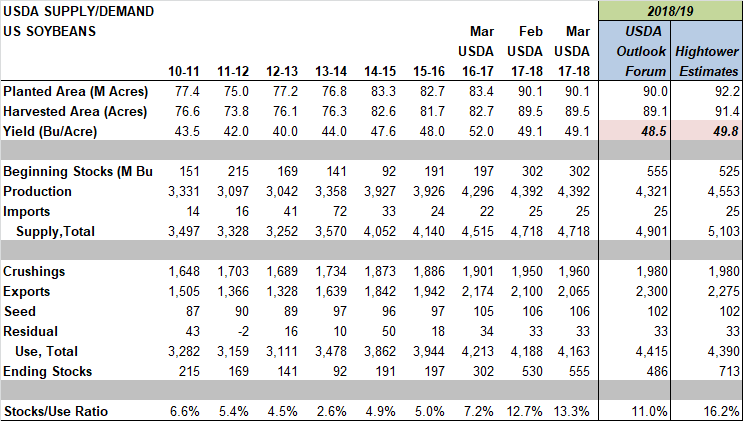
We think the USDA’s usage forecast for 2018/19 is a bit optimistic considering that Argentina and Brazil could both have record crops next year. Therefore, we are putting total usage at 4.39 billion bushels, which would bring ending stocks in around 713 million bushels, a record high and would result in a stocks/usage ratio of 16.2%, up from 13.3% for 2017/18, 7.2% for 2016/17, and 5% for the 2015/16. This is a potentially bearish factor for flat prices and also for the July/November spread.
[box type="info" border="full" icon="none"]This was originally published on March 15th to our subscribers...with trade suggestions. To get these reports as they are released Subscribe today or take a Free Trial![/box]
July/November Soybean Spread
 The July/November Soybean spread fundamentals continue to worsen, and the spread seems to have put in a short-term top. Historically, July has traded to a significant premium to the November contract in tight supply years, but when ending stocks have been plentiful, July Soybeans have generally fallen to a 15 to 40-cent discount to November, reflecting a carrying charge.
The USDA is currently projecting 2017/18 US ending stocks at 555 million bushels, which is only 19 million bushels below the 2006/07 record high of 574 million. More importantly, the stocks/usage ratio is now pegged at 13.3%, up from 7.2% last year.
 The chart compares the stocks to usage ratios to the lows for the July/November spread since 1971/72. The study suggests that a 13.3% ratio would point to a low in the July/November spread of around -15 cents. The current year spread traded as high as +43 ½ cents as recently as March 5th, and is it trading at +14 ¼ cents as of this writing. The low for the spread when stocks/usage reached the record high of 18.6% was -35 ¾ cents.
We expect ending stocks to remain fairly high for the old crop season, but we do not expect the stocks/usage ratio to get much higher than 13.3%, so a target of -5 to -10 for the spread may be appropriate. However, if producers in the US plant 92.2 million acres and the yield reaches 49.8 bushels/acre for the upcoming crop, ending stocks could surge to 713 million bushels and the stocks/usage ratio could reach 16.2% for 2018/19. In years when the stocks/usage was above 16%, the lows for the July/November spread have been -33, -21, -45, -40 -21 ¾, -14 and -35 ¾. The July19/November19 spread is currently trading at +35 cents.
With managed money fund traders holding a net long position of 183,711 contracts as of March 6th, the market is overbought and vulnerable to a long liquidation sell-off if traders turn bearish. Open interest is at the highest level since June 2016, so the market may experience increased selling if support levels are violated.
Download the Full Report (PDF)