
USDA Preview for September 12, 2017 Supply/Demand
SOYBEANS
 For the upcoming USDA reports, soybeans could be the market with the most volatility. The recent dry weather across a large portion of the Midwest has been accompanied by very mild temperatures. Traders have become familiar with the old mantra that corn yields are made in late July and soybean yields are made in late August. The last three years have illustrated how advancements in seed technology have boosted yields, with average yields of 47.6 bushels per acre in 2014-15, 48.0 in 2015-16 and 52.1 in 2016-17. In all three years, precipitation in August was normal or above normal.
While we do not feel that soybean yields will be significantly lower than the August USDA estimate of 49.4 bushels per acre, the recent drier trend may be detrimental to soybean pod development, and that could drag yields down a shade. Indiana, Illinois, eastern Iowa, eastern Missouri, Kansas and Wisconsin all had 50% of normal or less precipitation during August. This is reflected in recent analysts’ estimates, which averaged 48.7 bushels per acre. (Estimates ranged from 47 to 50.) However, the USDA may not have the data to take down yields that much in this report given that surveys and field analysis could be only 7-10 days old.
A dry outlook for the next ten days for most of the Midwest will continue to drag on yields, and this may be reflected in the October report. Our supply/demand table indicates that an eventual 2.4-bushel-per-acre decline from the August estimate would take ending stocks down to 263 million bushels. This could take soybean prices back up to $10.50 or higher.
Any significant weakness resulting from a neutral number next week’s report could present a buying opportunity.

CORN
 Corn demand data has been positive recently, with ethanol production this past week pointing to a possible 50-100 million-bushel upward revision in the USDA’s corn usage for ethanol estimate and US exports getting a boost from the weaker dollar. The recent crop tours have for the most part come in slightly below the USDA’s August yield forecast of 169.5 bushels per acre. The Farm Journal’s corn yield came in at 167.1 bushels per acre, and other private estimates ranged from 166.7 to 166.9.
The key variables in the various tours’ estimates were the Illinois and Iowa yields. The USDA has both Illinois and Iowa at 188 bushels per acre. Together these states account for 28% of the U.S. corn planted area, so a significant decline in either state’s yield could significantly affect the nation’s overall production. Crop tour estimates put Illinois’ yield anywhere from at 177 to 181 bushels per acre and Iowa’s at 181-184. The bottom line is that if the USDA takes both states down by 8-10 bushels per acre, a 3 to 4 bushel decline in the US yield is possible.
 The average analyst estimate for yield in the report is 167.9 bushels per acre, with a range of 165.5 to 171.2. Our supply/demand table for corn shows that a yield on the lower end of estimates does not really push the ending stocks into a tight situation. Still, with strong ethanol use, a cheaper dollar, stronger Brazilian real, and China’s new policy of marketing old corn stocks for industrial use while boosting soybean planted area and reducing corn planted area, the peak in ending stocks may have passed.

WHEAT
 U.S. all wheat ending stocks are coming down in 2017/18, but the overall supply outlook is still quite large. The average estimate for the upcoming report has 2017/18 US ending stocks coming in at 914 million bushels, down from 1.184 billion bushels in 2016/17, but the stocks to usage ratio is expected to be around 43%.
Winter wheat acreage was the lowest in more than 100 years, but the Chicago and Kansas City futures are trading back to levels seen last year. The drought in the spring wheat areas caused the Minneapolis contract to rally nearly $3.00 dollars per bushel in July, but the market has fallen $2.00 dollars off its highs.
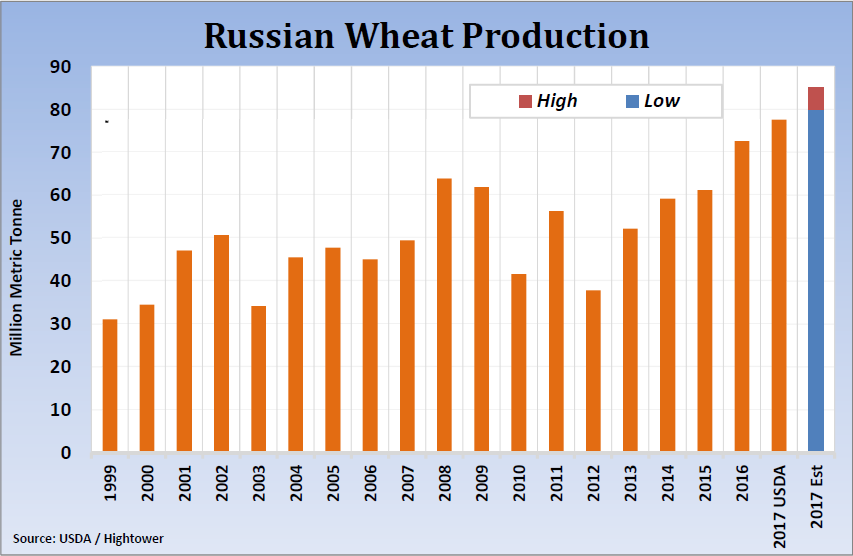
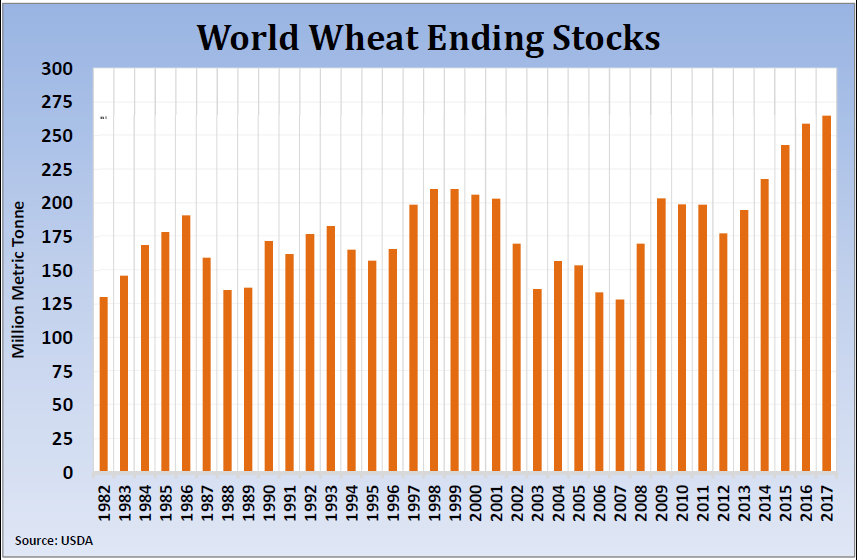 The real issue in the wheat market is that world ending stocks are forecast to be a record 264.7 million tonnes, which would bring the stocks to usage ratio to around 36%. For Tuesday’s USDA report, the average estimate for world ending stocks is 264.3 million tonnes, little changed from last month. Private estimates have put Russian production anywhere from 80 to 85 million tonnes this year versus the August USDA forecast calling for 77.5 million tonnes. This type of increase has and should continue to be a bearish influence on world wheat prices as well as US wheat exports. Until there is a significant weather event that curtails production in one of the world’s top producing areas, wheat prices will be subdued.
Like last year, fund managers could end up using the Chicago Wheat contract as the short leg of a spread trade against other commodities. This could swell the managed money short position in Chicago Wheat to such levels that could result in violent, short covering trade action. If nearby Chicago Wheat trades down to the $4.00-$4.20 level, downside risk would be quite limited.
-Matt Connelly